1
Dashboard and financial reports
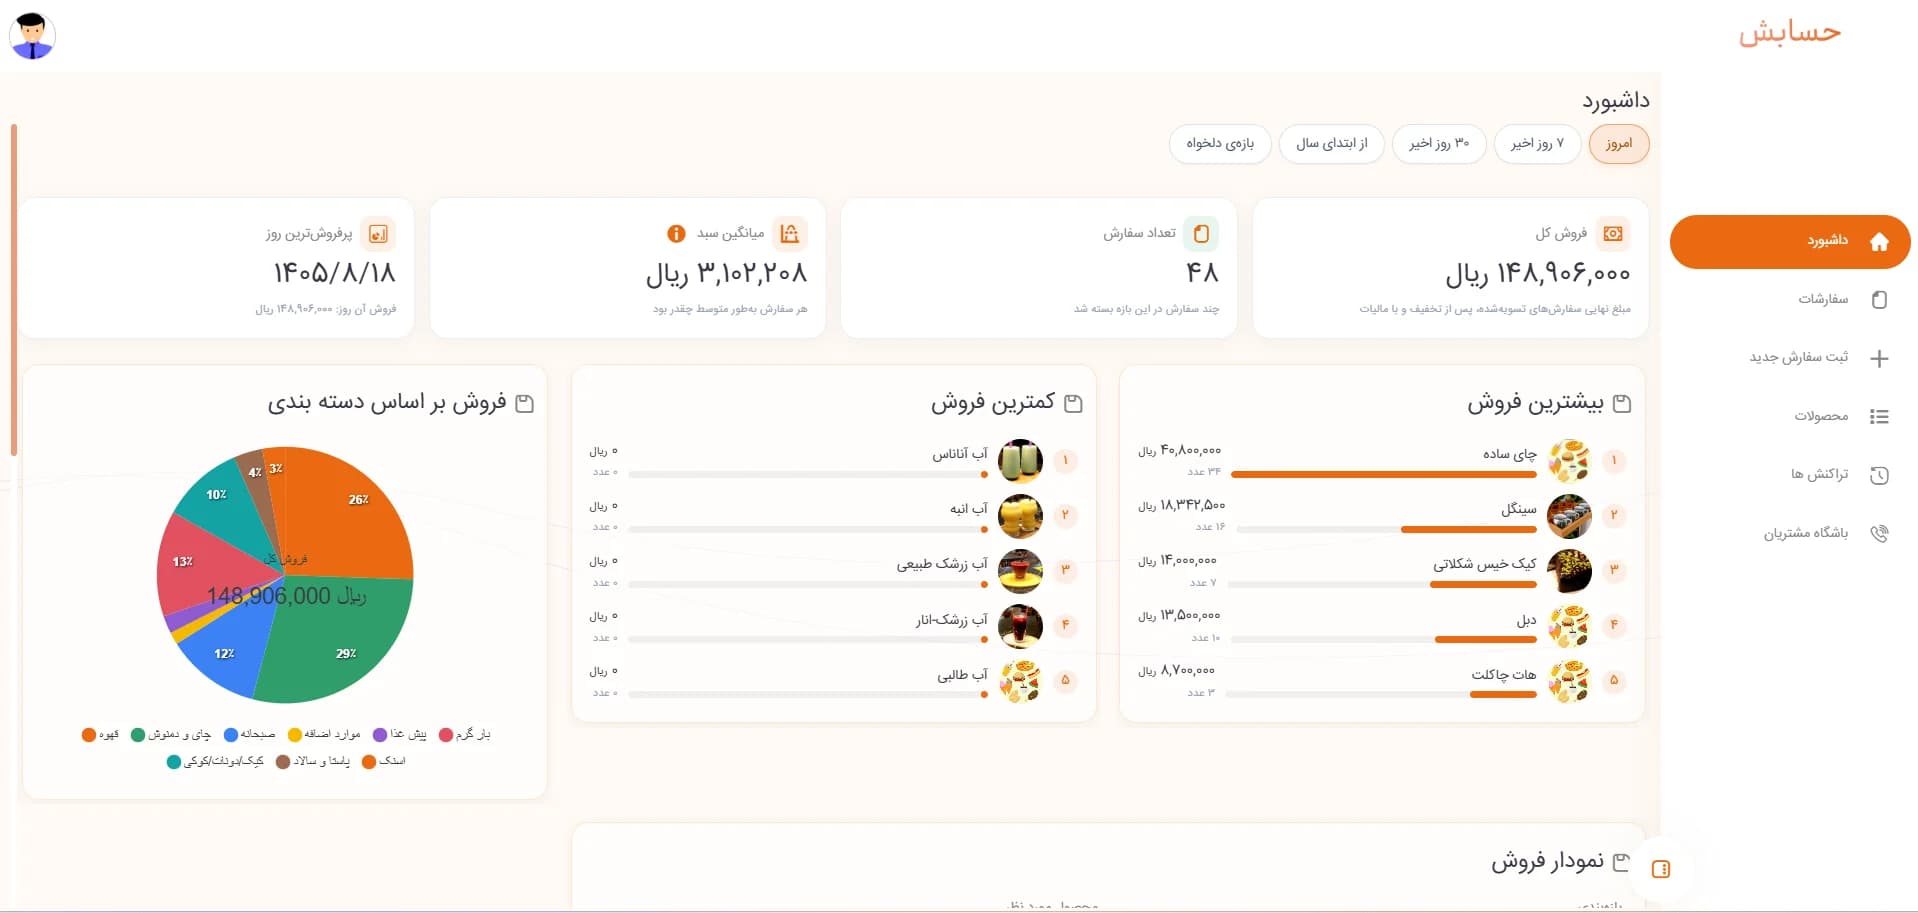
One glance tells you how much you sold today, this week or since the start of the year — and where it came from.
- Total sales for any range: today, 7 days, 30 days, year to date or a custom range
- Order count, average order value and best day
- Sales by category as a pie chart
- Best- and worst-selling products
- Sales chart by product and category
Dashboard and sales reports